Bull Flag Pattern: How to Trade This High-Probability Breakout Setup
In Thomas Bulkowski's bull-market perfect-trade flag study, upward breakouts had a 44% break-even failure rate, a 9% average rise, and a 46% adjusted-target hit rate. Those historical results do not make a visual bull flag an EasySwing strategy or predict any individual trade.
The bull flag is one of the most searched setups in technical analysis — and one of the most misapplied. This guide covers the complete pattern: anatomy, the nine-condition entry checklist, stop placement, profit targets, and which market regimes produce the statistical edge. For the structural comparison against the pennant variant — and why pennants carry a materially weaker success rate — see Flag and Pennant Patterns.
The Bull Flag Pattern Defined
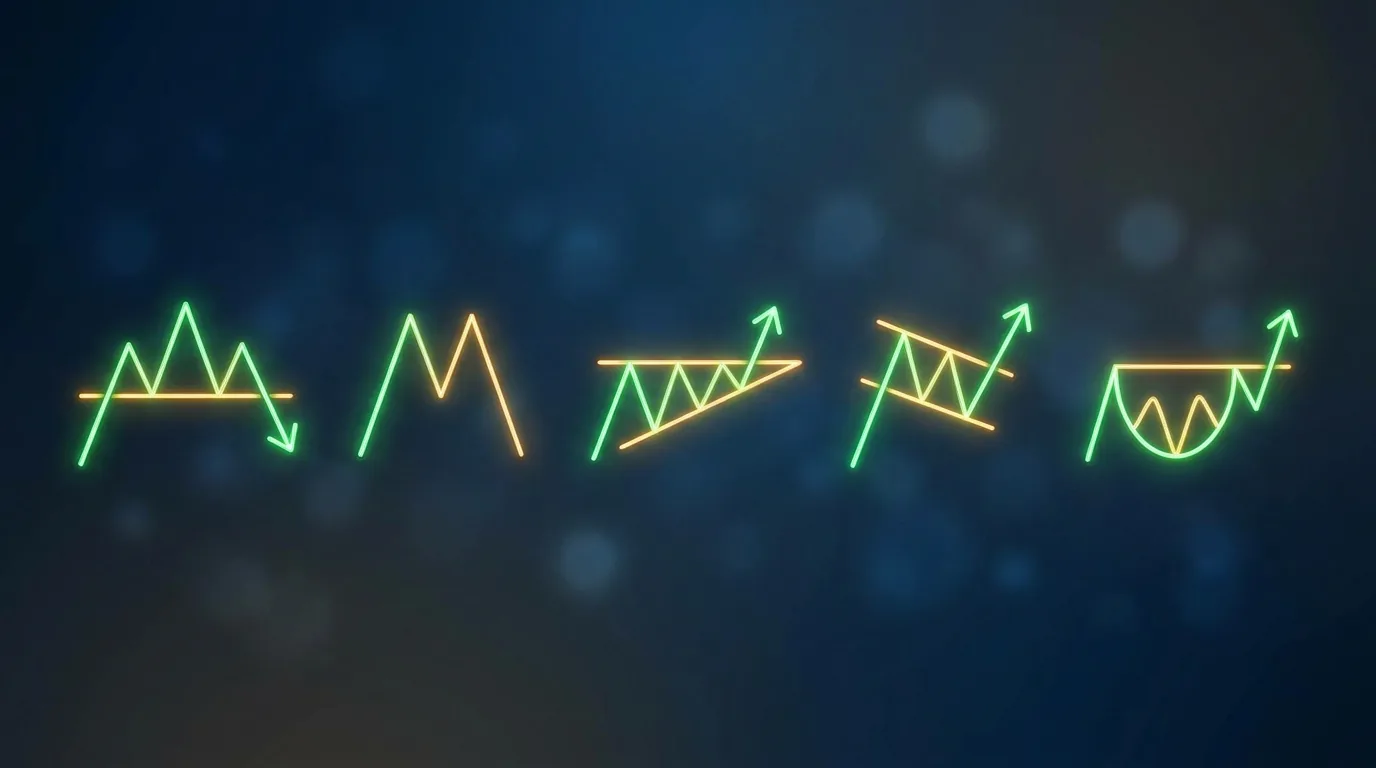
A bull flag — also called a bullish flag pattern — is a bullish continuation pattern: a sharp advance (the "pole") followed by a tight downward consolidation (the "flag"), then a breakout that resumes the advance. The pattern signals that sellers during the pause lacked conviction: when buying returns, the stock typically continues its prior move.
The pattern is meaningful because of what it reveals about supply and demand. After a sharp advance, early buyers take partial profits and short-term traders test the move. If the stock holds without giving back much ground — and volume contracts during the consolidation — selling pressure is light. When institutional buying returns, the stock clears the flag and typically extends the advance by a measured amount equal to the original pole height.
The Three Components of a Bull Flag
A bull flag consists of three sequenced phases: a high-volume advance (the pole), a declining-volume downward channel (the flag), and a breakout above the channel on expanding volume. Each phase has specific measurable criteria — missing any one reduces the pattern's statistical reliability significantly.
- The pole: A sharp, high-volume advance of 10% or more over 3-10 days. The steeper and faster the pole, the more meaningful the setup. A slow, grinding advance does not create the supply and demand imbalance that a bull flag resolves.
- The flag: A tight, downward-drifting channel lasting 3-15 trading days. Volume contracts during this phase as selling pressure eases. The flag should retrace no more than 38-50% of the pole — larger retracements signal that buyers are not in control.
- The breakout: Price closes above the upper trendline of the flag channel on above-average volume. This confirms that buyers have re-engaged and the advance is likely to continue.
A shallow channel preserves more of the pole's momentum than a deep retracement. Treat the percentage ranges here as chart-reading conventions, not EasySwing detector gates or guaranteed success thresholds.
Confirming the Uptrend: The EMA Stack
A bull flag is conventionally read after an established advance. A rising moving-average stack can support that context, but EMA9 > EMA20 > SMA50 is not part of a universal bull-flag definition or an EasySwing Bull Flag gate.
EMA9 > EMA20 > SMA50This is the Stage 2 moving average structure. In a bull flag, the 9-day exponential moving average leads the advance, with the 20-day and 50-day trailing behind. During the flag phase, price typically dips toward — but not through — the EMA9/EMA20 support zone. When price bounces off the EMA zone and breaks above the flag's upper channel line, the entry is at its highest-probability point.
The EMA stack is an objective filter. A stock with EMA9 below EMA20 is not in a confirmed uptrend, and any downward channel on its chart is not a bull flag — it is a declining channel in a declining stock. Do not force the pattern where the structure is absent.
Bull Flag Entry Checklist
A bull flag entry requires confirming three categories simultaneously: pattern structure (pole height, flag depth, channel direction), quality filters (RS rank above 80, proximity to highs), and timing triggers (breakout on 1.5× or more above-average volume). Missing any category reduces the setup from high-probability to a coin flip.
Apply the following checklist before every entry:
- ✅ Prior advance (pole) of at least 10%, completed in 3-10 trading days
- ✅ EMA9 > EMA20 > SMA50 stack confirmed on the daily chart
- ✅ Flag channel sloping downward — not flat and not upward (those are different patterns)
- ✅ Flag retraces 25-50% of the pole, not more
- ✅ Volume contracts during the flag phase; no high-volume down-days
- ✅ RS rank at 80 or above — buy the strongest stocks, not the weakest
- ✅ Breakout candle closes above the upper flag channel trendline
- ✅ Breakout volume is 1.5× or more above the 50-day average
- ❌ Do not enter if the flag retraces more than 50% of the pole — the advance was too weak
- ❌ Do not enter if volume expands on down-days during the flag — sellers are still active
- ❌ Do not enter if the market regime is Ranging or Trending Down — bull flags fail when the macro trend works against you
The RS rank filter matters. William O'Neil documented in How to Make Money in Stocks (2009) that the best institutional breakout stocks consistently showed RS rank above 80 before their major advances. Buying bull flags in sub-70 RS stocks means buying relative weakness — you are picking the slowest runner in the race.
Stop Placement and Profit Targets
The bull flag's structure mathematically defines both the stop and profit targets before entry. Stop below the flag's lowest point or 1.5 ATR below entry — whichever is tighter. First target adds the pole's full height to the breakout price. These levels are set before entering, not adjusted based on market movement.
Here is how the levels work in practice:
- Stop loss: Below the flag's lowest close, or 1.5 ATR below entry — use whichever is closer. The flag low is the pattern's invalidation level. If price returns there, the breakout has failed.
- Target 1 (T1): Add the pole's full height to the breakout price — the measured move. Scale out 50% of the position at T1.
- Target 2 (T2): 2.5 ATR above entry. Trail the remaining position below the most recent swing low to capture the full continuation move.
- Maximum hold: 15 trading days. If T1 is not reached within that window, the momentum has faded — close the trade and redeploy capital.
The stop and targets above are conventional chart-reading examples, not EasySwing-generated Bull Flag levels. Their actual risk/reward depends on the chart, spread, slippage, and entry. For the underlying calculation, see the position sizing guide.
When Bull Flags Perform Best
Market regime provides context for a visual bull flag, but EasySwing's five states are categorical rather than a linear bullish-to-bearish score. The public evidence does not support assigning a precise win-rate range to each state.
| Regime | Context |
|---|---|
| Trending Up | Bullish continuation is aligned with the broader backdrop |
| Ranging | Breakouts have less directional support from the market |
| Transitioning | Direction is unspecified; mixed or incomplete inputs require independent confirmation |
| High Volatility | Wider daily ranges can make the channel and breakout noisier |
| Trending Down | A bullish continuation is fighting the broader backdrop |
Always check the market context separately from the visual pattern. A Trending Down state does not make a bullish breakout impossible, but it does mean the pattern is fighting the broader backdrop.
How EasySwing Identifies Bull Flag Structures
EasySwing has no named Bull Flag strategy or detector. Two active strategies can produce charts that look flag-like, but they evaluate different mechanics and do not classify the parallel-channel shape.
VCP Breakout evaluates progressive range contractions, relative strength, trend, and breakout conditions. It does not require a prior flagpole or identify a parallel flag channel.
Trend Pullback evaluates a pullback into a rising EMA zone and a qualifying bounce. It does not require a sharp pole or an expanding-volume breakout.
When EasySwing returns a VCP or Trend Pullback candidate, the trader can separately inspect whether its chart resembles a bull flag. The A+/A/B+/B/C grade scores the detected strategy's criteria, not bull-flag quality. Run a scan at strategies to see active setups.
Common Bull Flag Trading Mistakes
The four most costly bull flag errors are chasing the pole advance, accepting a deep flag, entering on a low-volume breakout, and holding through a macro regime shift. Each error is avoidable by reading the full entry checklist before entering the trade, not after the position is open.
Chasing the pole. The pole advance is already completed when you identify the pattern. Buying after the sharp rise — hoping to participate in more of the original move — puts you in at exhaustion, not at a low-risk point. Wait for the flag to form and buy the breakout, not the original advance.
Accepting a deep flag. A deep retracement weakens the pole-and-channel interpretation and may indicate a new base rather than a short continuation pause. Do not turn a visual convention into a hard EasySwing rule.
Buying an unconfirmed breakout. Volume expansion can add context, but no universal 1.5× or 2× threshold guarantees follow-through. Confirm the close beyond the channel and evaluate liquidity and volume against the stock's own history.
Ignoring a regime change. A shift to High Volatility or Trending Down removes a supportive backdrop. Reassess the trade under the user's own exit and risk rules; an EasySwing grade belongs to the detected named strategy, not to the visual bull flag.
Key Takeaways
- A bull flag is a two-phase continuation pattern: sharp advance (pole) + brief downward consolidation (flag) + breakout above the channel on expanding volume
- A rising moving-average stack can support the prior-trend context, but it is not a universal definition
- Retracement depth and contracting volume are chart-reading quality checks, not EasySwing detector gates
- Pattern-based stops and measured targets are user-managed conventions; EasySwing does not emit Bull Flag trade levels or a hold duration
- Regime is contextual: EasySwing publishes five categorical states and does not assign the visual pattern a win-rate table
- EasySwing does not classify Bull Flags; VCP Breakout and Trend Pullback may overlap visually but use different detector rules
Frequently Asked Questions
How is a bull flag different from a VCP?
Both are bullish chart structures, but they are not the same detector concept. A bull flag is a visual pole-and-channel pattern. EasySwing's VCP detector evaluates progressive range contractions and other quantitative gates; it does not require a flagpole or classify the channel shape.
How long should a bull flag take to form?
A bull flag is conventionally a short pause after a sharp advance, often measured in days rather than months. There is no EasySwing Bull Flag detector or hard duration gate; as a consolidation lengthens, reassess whether it is still a flag or a broader base.
What volume should I see on the breakout?
Look for volume expansion relative to the stock's own recent baseline, but do not treat 1.5× or 2× as a universal validity threshold. A close beyond the channel, liquidity, and the broader context all matter.
Can a bull flag work in a ranging market?
A visual bull flag can break out during a Ranging state, but the market provides less directional support. EasySwing does not publish a Bull Flag win rate for that state, and its regime label does not validate the visual pattern.
What is the difference between a bull flag and a pullback to the EMA?
A pullback to the EMA is a dip into a rising moving-average zone; no sharp pole is required. A bull flag is a visual pole-and-channel pattern. The shapes can overlap, but only the Trend Pullback detector's own rules determine whether EasySwing reports that named setup.
EasySwing.trading does not run a named Bull Flag detector. Its VCP Breakout and Trend Pullback strategies can overlap visually with flag-like charts, but their A+/A/B+/B/C grades score their own quantitative criteria. See related guides on the bear flag short setup and active swing trading strategies. Scan results are for informational purposes only. See our Risk Disclaimer.
Disclaimer: This article is for educational purposes only and does not constitute investment advice. EasySwing is a stock screening tool, not a registered investment advisor. All trading involves risk. Read our full disclaimer →